
The United Nations Conference on Trade and Development (UNCTAD) releases the World Investment Report (WIR) every year as an annual assessment of trends in foreign direct investment (FDI), strategies to enhance its contribution to development, and global value chains. Moreover, the WIR includes an in-depth analysis of international investment trends and their developmental implications. The most recent edition of the report highlights the changes in global FDI flows, that have occurred due to the effects of current global geopolitical and economic uncertainties around the world, and the policy measures needed to support sustainable development through investment.
In contrast, the FDI environment hangs precariously in a world grappling with regional and global conflict and crises. On the other hand, the existing challenges are interconnected and multifaceted. International supply chains are reconfiguring, trade networks are fragmenting, and regulatory environments are diverging as a result of geo-economic fragmentation, which is also reshaping the landscape of global investment. These challenges create both obstacles and isolated opportunities, where some countries benefit from investments in global value chain-intensive manufacturing while others find it difficult to engage in the global economy. All this has affected the predictability of global investment flows and created stumbling blocks and barriers to FDI.
The 2024 WIR serves as a complete reminder that investment is the fuel that supports progress toward the Sustainable Development Goals (SDGs) and the 2030 Agenda for Sustainable Development. Put another way, the 2024 WIR serves as a lifeline for developing nations and as the lifeblood for achieving the SDGs. The WIR also focused on investment management and enhancing government digitalization, which was evident from its theme: “Investment Facilitation and Digital Government.”
This study aims to provide an overview of trends in FDI flows over the past 33 years, as well as highlight key findings from the WIR regarding FDI flows and funding challenges for the SDGs. Finally, we will attempt to project the trends of FDI flows into the future.
Global FDI flows trends 1990-2023:
FDI flows have experienced significant changes from 1990 to 2023, influenced by various global economic, political, and technological factors. Here’s a brief analysis of FDI trends during this period:
The 1990s: Impact of globalization
The 1990s saw Eastern European countries opening up, which led to increased FDI flows into these regions. Additionally, economic reforms in China continued to attract significant FDI. Also, the establishment of the World Trade Organization (WTO) in 1995 and various regional trade agreements facilitated cross-border investments. Technological advancements have reduced barriers to international business, encouraging Multinational Enterprises (MNEs) to make foreign investments.
The 2000s: Fall after boom
During this period, there was a boom in technology-driven investments, followed by a bust that caused a significant decline in global FDI flows. Also, BRICS emerged as major FDI destinations due to their large markets and high economic growth rates. This boom did not last long, and then the Global Financial Crisis occurred in 2008, which led to a sharp decline in global FDI flows as investors became more risk-averse. However, developed countries were more affected, with many MNEs having withdrawn their investments abroad.
The 2010s: Post-crisis recovery and new challenges
The early 2010s saw a gradual recovery in FDI flows, but this recovery was uneven across regions. Moreover, this period brought with it new challenges such as the digital economy (FDI has been driven to tech-heavy regions like Silicon Valley, China, and India); protectionism and trade wars (most notably the US-China trade war); and sustainable and green investments (driven by environmental concerns and SDGs).
2020-2023: COVID-19 pandemic and beyond
The pandemic caused a significant reduction in global FDI flows in 2020 as economic uncertainties, and lockdowns led to a slowdown in FDI flows. The recovery efforts during and after the pandemic impacted and stimulated FDI in the technology and innovation sectors, leading to an increase in digital transformation and the establishment of robust supply chains. Ongoing geopolitical tensions, including the Russia-Ukraine conflict, U.S.-China relations, and other regional conflicts such as the Red Sea attacks, and opposition to the Belt and Road Initiative, created uncertainties affecting global trade and FDI flows.
The following figure illustrates the trends in FDI over the last 33 years, as discussed previously:
Figure 1: FDI inflows and outflows trends by economic grouping 1990-2023
FDI inflows
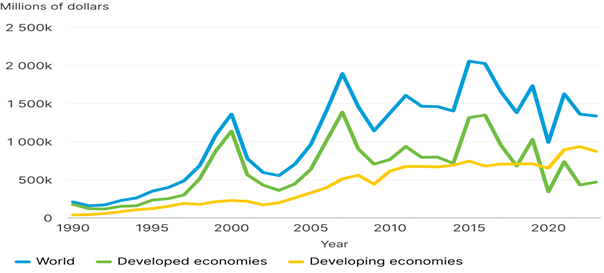
Source: UNCTAD, World Investment Report 2024, https://unctad.org/publication/world-investment-report-2024.
We can see from the previous figure that the value of FDI inflow into developing economies exceeded that of developed economies during and after the COVID-19 pandemic period. We also note that FDI flows in developing economies have been more stable over the past 33 years compared to developed economies and worldwide.
FDI outflows
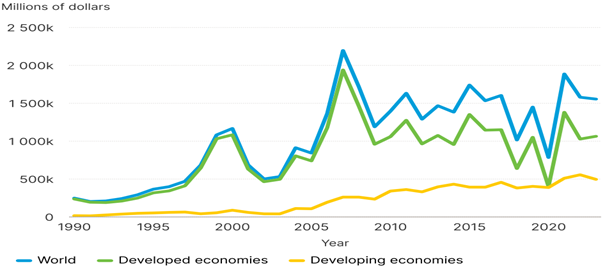
Source: UNCTAD, World Investment Report 2024, https://unctad.org/publication/world-investment-report-2024.
Global investment trends 2022-2023
According to the World Investment Report, global FDI fell by 2 percent to $1.3 trillion in 2023 amid an economic slowdown and rising geopolitical tensions. This decline in FDI flows underscores the urgent need to change investment policies in many countries and adopt robust investment strategies to counteract the adverse effects of FDI decline and global disruptions. Financing for international projects has been weak in both developed and developing countries, as we see that the value of financing for international projects in developed countries decreased by 23 percent in 2023 compared to 2022, while the number of projects decreased by 21 percent. As for developing countries, the number of projects and their value decreased by more than a quarter. The reasons for this decline can be attributed to changing financing conditions and fluctuations (or volatility) in the financial markets.
Cross-border mergers and acquisitions (M&A) significantly impact FDI in developed and developing countries. Cross-border M&A value ended 2023 at just over half for developed countries and declined approximately one-third for developing countries, compared to the value seen in 2022, while cross-border M&A numbers in developed and developing countries decreased by 13 percent and 19 percent, respectively. In addition, both the number and value of greenfield project announcements in developed countries decreased marginally compared to 2022 (decreased by 8 percent for greenfield project value; decreased by 6 percent for greenfield project numbers). Conversely, greenfield project announcements in developing countries increased by 20 percent in value and by 15 percent in number.
Table 1: Global investment trends 2022-2023
| Economic grouping | Value (Billions of dollars) | Numbers | |||||
| Type of Investment | 2022 | 2023 | Growth (%) | 2022 | 2023 | Growth (%) | |
| Developed economies | Greenfield projects | 687 | 631 | -8 | 11112 | 10435 | -6 |
| International project finance | 728 | 562 | -23 | 1720 | 1357 | -21 | |
| Cross-border M&As | 599 | 302 | -50 | 6710 | 5862 | -13 | |
| Developing economies | Greenfield projects | 622 | 749 | 20 | 6949 | 8007 | 15 |
| International project finance | 573 | 396 | -31 | 1138 | 839 | -26 | |
| Cross-border M&As | 107 | 76 | -29 | 1053 | 855 | -19 | |
Source: UNCTAD, World Investment Report 2024: Investment facilitation and digital government, p. 4.
In addition, although global FDI declined by 2 percent, MNEs led FDI in developed economies to increase by 9 percent to $464 billion through their financial transactions. Furthermore, developed economies increased their share in global FDI flows by 4 percent compared to 2022. On the other hand, developing countries accounted for 65 percent of global FDI flows in 2023, with a decline in their share of global FDI flows of 4 percent, but their FDI flows decreased by 7 percent to $867 billion compared to 2022.
For other regions, FDI flows (see Figure 2) declined by 8, 5, 3, and 1 percent for Asia, North America, Africa, and Latin America and the Caribbean, respectively.
Figure 2: FDI inflow trends by economic grouping and regions 2022-2023
(Billions of dollars and percentage change)
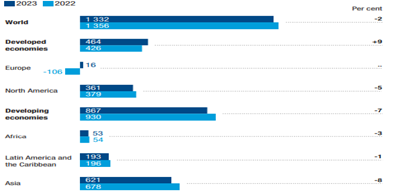
Source: UNCTAD, World Investment Report 2024: Investment facilitation and digital government, p. 6.
Investment trends in Africa 2022-2023
The decline in international projects and FDI flows is driven by tighter financing conditions and a slowdown in sustainable finance markets, which are critical for investment in infrastructure and effective contribution to a sustainable future. FDI decline has also made the poorest countries more vulnerable to the global downturn in infrastructure investment. Also, FDI in Africa decreased by 3 percent to $53 billion as a whole, but it decreased in Central Africa and North Africa by 17 percent and 12 percent, respectively.
In addition, political instability and insecurity on the continent, especially in the Sahel region, Central Africa, and some countries in North Africa, increase expectations of a decline in FDI flows in these regions. In contrast, the Southern Africa region has seen an increase in the volume of FDI flows by 22 percent to $9 billion. Africa is expected to become a hotspot for FDI flows and the Next Frontier of global investment, economic growth, and development, but progress will remain slow if conditions remain as they are.
Figure 3: FDI inflow to African regions 2022-2023
(Billions of dollars and percentage change)
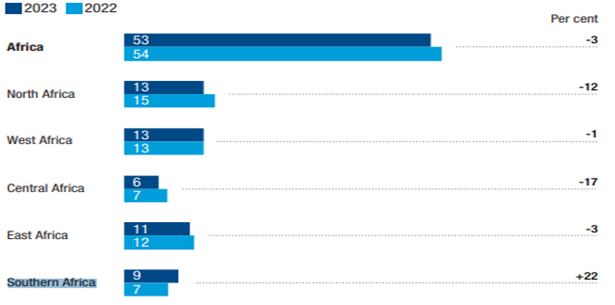
Source: UNCTAD, World Investment Report 2024: Investment facilitation and digital government, p. 12.
Investment trends in Europe 2022-2023
What is striking in the 2024 WIR is the significant change that has occurred in Europe, where FDI inflows jumped dramatically, from negative $106 billion in 2022 to positive $16 billion in 2023. Several economies, including Ireland, the United Kingdom, the Netherlands, Luxembourg, and Switzerland, reported large negative numbers when the 2022 and 2023 inflows were taken into consideration together. Lower negative flows affected positively FDI flows in Europe in 2023. Excluding EU countries, where FDI inflows move from negative $85 billion to positive $59 billion, FDI to other European countries continues to decline from negative $21 billion to negative $42 billion.
Figure 4: FDI inflows trends in Europe and developed countries 2022-2023
(Billions of dollars and percentage change)
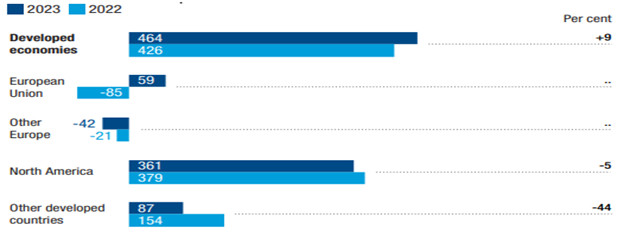
Source: UNCTAD, World Investment Report 2024: Investment facilitation and digital government, p. 10.
Figure 5: FDI inflows trends in Europe 1990-2023
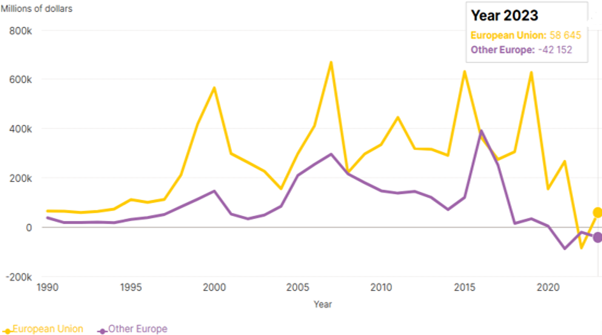
Source: UNCTAD, World investment report 2024, FDI Data Explorer, https://unctad.org/publication/world-investment-report-2024
We can see from the previous figure that FDI flows were not negative during this period until after 2019, and this coincided with the period of the COVID-19 pandemic and the Russia-Ukraine war.
Investment trends in Asia 2022-2023
In Asia, FDI declined by 8 percent to $621 billion. Asia was also by far the largest recipient of FDI, accounting for nearly half of global inflows (about 47 percent in 2023). In Asia, East and South-East Asia were the main recipients. Globally, China is the second-largest recipient of FDI in the world and has seen a rare decline in inflows. In East Asia, FDI flows declined, with a significant fall in China, breaking a decade-long growth trend. Also, big declines were recorded in India and West and Central Asia; only South-East Asia kept steady as a result of robust economic growth and extensive GVC linkages. Industrial investment in Asia remains buoyant, as shown by greenfield announcements, but the global downturn in project finance also affected this region. With nearly a quarter of all FDI globally, the U.S. continues to be the world’s largest recipient of FDI, followed by China, Singapore, and Hong Kong, China. Also, China and Hong Kong account for 21 percent of global FDI. Moreover, the three Asian economies accounted for 33 percent of global FDI in 2023. FDI flows in China declined by almost 14 percent to $163 billion. In contrast, it increased in Singapore and Hong Kong, China, by 13 percent and 3 percent, respectively. While India fell to 15th place in 2023 after being ranked 8th in 2022, its FDI decreased by 43 percent to $28 billion. Japan also fell to 19th place in 2023 after it ranked 13th in 2022, and its FDI decreased by 38 percent to $21 billion.
Figure 6: FDI inflows trends in the top 20 recipients
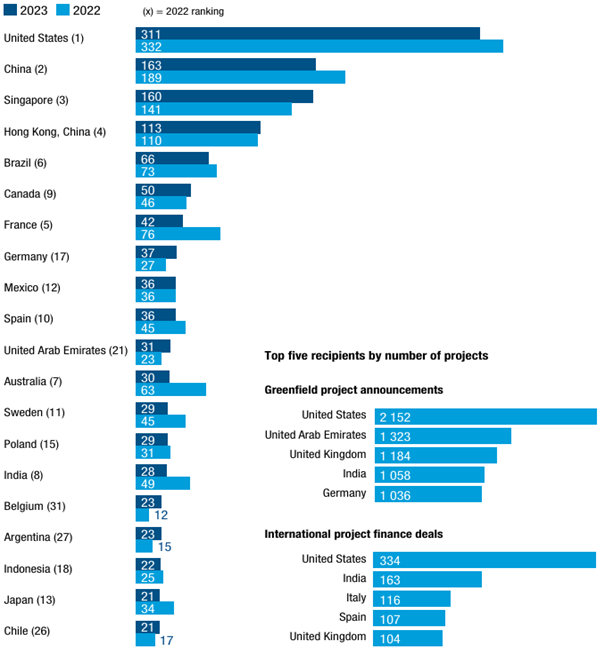
Source: UNCTAD, World Investment Report 2024: Investment facilitation and digital government, p. 9.
Figure 7: FDI inflows trends in Asia
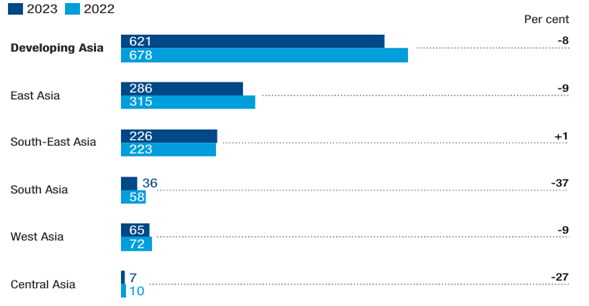
Source: UNCTAD, World Investment Report 2024: Investment facilitation and digital government, p. 14.
The preceding figure indicates that Singapore is the only one among the selected countries that has maintained the growth of FDI flows since the COVID-19 pandemic, and investments in it are increasing exponentially.
Figure 8: FDI inflows trends in selected countries in Asia 1990-2023
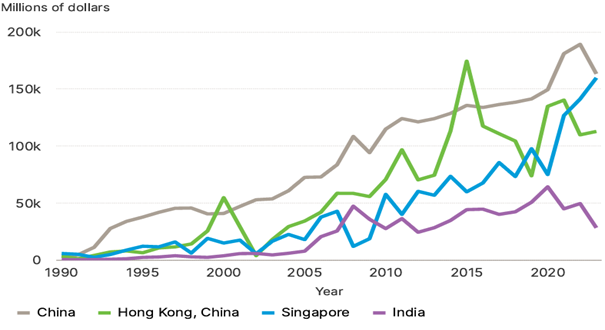
Source: UNCTAD, World investment report 2024, FDI Data Explorer, https://unctad.org/publication/world-investment-report-2024
Asia continues to attract mega-projects; six of the ten largest projects worldwide are located in developing Asia, including four in South-East Asia, and the top destination for announced greenfield projects by value in Asia was Indonesia. Also, one of the notable projects included upstream investments totaling $11 billion by Xinyi Group (a Chinese glass and solar manufacturer). Additionally, a consortium of European and Indonesian companies is investing $9 billion to develop battery supply chains for electric vehicles. West Asia was the exception, with total deals increasing to 94 in 2023 compared to 50 in 2022, and values growing by 32 percent to $57 billion as Saudi Arabia, Turkey, and the United Arab Emirates have higher numbers of deals.
Moreover, it should be noted that several key factors have influenced the trends in global investment from 2019 to 2024. Some of these factors are as follows:
Global trade trends
There has been a noticeable fluctuation in global flows of FDI, influenced by geopolitical tensions, trade policies, economic uncertainties in various regions, supply chains, rising shipping costs, environmental preservation, expanding investment in renewable energies, and striving to achieve sustainable development goals. In addition, during Q1 2024, global trade trends recovered and have turned positive but unevenly across sectors (where trade growth varied across industries, with green energy and AI-related products experiencing stronger increases) and across regions (where global trade growth was driven by increased exports from China, India, and the United States, while Europe and Africa disappointed).[1]
Figure 9: Global trade in goods and services Q1 2019 to Q1 2024
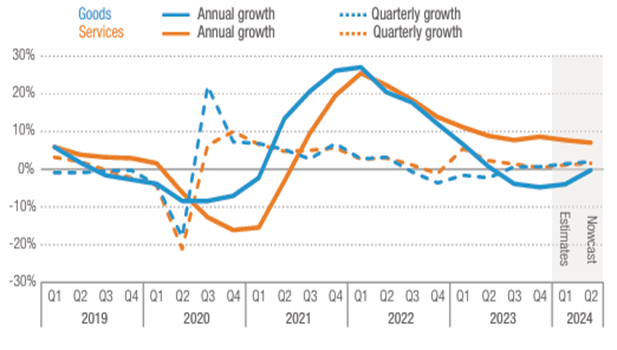
Source: UNCTAD, Global trade Update, Special insight: Trade and industrial policy, July 2024, p. 2, https://unctad.org/system/files/official-document/ditcinf2024d2.pdf.
Sustainable Development Goals (SDGs) funding challenges:
The recent WIR revealed a decline in financing for the SDGs due to a significant decrease in investments in sectors related to the SDGs, which could hinder the path to achieving the 2030 Agenda for Sustainable Development Goals. According to the 2024 WIR, “tight financing conditions in 2023 led to a 26 percent downturn in international project finance,” which plays a major role in infrastructure investment in power and renewable energy, among other areas. This led to a decrease in investment in SDG-linked sectors of more than 10 percent. Also, the report highlights that agrifood systems and water and sanitation attracted fewer internationally financed projects in 2023 than in 2015.
The UN Secretary-General António Guterres underscores in the report’s preface that investment is the fuel for achieving sustainable development goals, and insufficient SDG funding is hindering the implementation of the 2030 Agenda for Sustainable Development, particularly in least-developed countries (LDCs). He also pointed out that closing the SDG and climate financing gap will require an estimated $1,000 billion per year ($500 billion of international public finance and $500 billion of international private finance), much of which would be in the form of FDI. “We need urgent action to remove obstacles and provide a transparent, streamlined investment climate for sustainable development,” he writes.[2]
What is remarkable, though, is the statement that $1,000 billion is required to close the sustainable development financing gap, which contradicts the 2024 Financing for Sustainable Development Report, which noted that the development financing gap was estimated at $4.2 trillion annually, up from $2.5 trillion prior to the COVID-19 pandemic. Meanwhile, rising geopolitical tensions, climate disasters, and a global cost-of-living crisis have hit billions of people, battering progress on healthcare, education, and other development targets.[3]
The 2024 Financing for Sustainable Development Report (FSDR 2024)[4] titled “Financing for Development at a Crossroads” says urgent steps are needed to mobilize financing at scale to close the development financing gap. The report also says SDG financing challenges are at the heart of the world’s sustainable development crisis, as staggering debt burdens and sky-high borrowing costs prevent developing countries from responding to the confluence of crises they face. Only a massive surge in financing and a reform of the international financial architecture can rescue the SDGs.
The 2024 WIR findings:
- The pace of growth in SDG investment through sustainable finance products in global capital markets is slowing down.
- Digitalization has a great role in developing countries as a stepping stone for wider digital government implementation, which can bolster weak governance and institutions and improve investment flows.
The 2024 WIR recommendations include the following:[5]
- It recommends a “bottom-up” approach to digital government tools, starting with basic business services and gradually expanding coverage to more institutions “to capture economies of scale and scope and extend benefits to all businesses.”
- Boost FDI flows on infrastructure projects, especially in developing countries, to support stability and long-term economic growth.
- Countries and institutions encourage investment regimes aligned with the SDGs.
- Governments promote investment in sustainable development projects, including through outward investment promotion measures and provisions in international agreements.
- Institutional investors should set more ambitious targets for fossil fuel divestment and increased investment in renewables.
- Systematic efforts must be pursued to address greenwashing (which refers to the deceptive tactics behind environmental claims), including well-defined product standards, robust sustainability disclosures, external auditing, and third-party ratings.
Some, like Manocha (2021),[6] believe that developing countries desire to achieve economic development by attracting FDI flows with less stringent environmental conditions, which could lead to environmental degradation in these economies due to the transfer of a large number of manufacturing units from developed countries to developing countries without taking into account environmental concerns.
Conclusion: FDI trends and outlook
Developing countries and emerging markets will become more attractive destinations for FDI due to their growth potential, investment opportunities, and demographic advantages. These countries, especially in Africa, have many untapped resources that represent important opportunities to attract foreign investments, especially in the field of renewable energies. Similar to the countries of the Sahel and North Africa, they have great potential in the field of solar energy, which requires huge foreign investments to exploit.
Additionally, the instability of many regions has contributed to the negative FDI flows, which will now shift in search of favorable opportunities, flexible environments, and economic alliances such as:
- BRICS (Brazil, Russia, India, China, and South Africa). The BRICS group was recently joined by five new countries).
- NAFTA (North American Free Trade Agreement) between the USA, Mexico, and Canada.
FDI flows will be based on the principle of investing in friends through geopolitical alignment. In this regard, policymakers are looking at friend-shoring to ensure, at least during short- and medium-term supply chains are less vulnerable to geopolitical tensions.
[1] UNCTAD, “Global trade Update, Special insight: Trade and industrial policy,” July 2024,
https://unctad.org/system/files/official-document/ditcinf2024d2.pdf .
[2] UNCTAD, World Investment Report 2024: Investment facilitation and digital government (New York, United Nations, 2024), P.III., https://unctad.org/system/files/official-document/wir2024_en.pdf.
[3] “Massive investment and financial reform needed to rescue SDGs,” UN News, April 9, 2024, https://news.un.org/en/story/2024/04/1148411.
[4] United Nations Inter-agency Task Force on Financing for Development, Financing for Sustainable Development Report 2024: Financing for Development at a Crossroads (New York: United Nations, 2024), https://desapublications.un.org/file/20487/download.
[5] IISD, “New Funding for SDGs Sectors Down 10%: World Investment Report 2024,” July 12, 2024,
https://sdg.iisd.org/news/new-funding-for-sdgs-sectors-down-10-world-investment-report-2024/.
[6] Manocha, R., “Do FDI Flows Lead to Environmental Degradation in Developing Economies? A Case Study of Select Asian Economies,” Vision 28, no. 2 (2024), 237-250. doi: https://doi.org/10.1177/09722629211035491.